Viewing Time-Temperature Curve for Video/Live Stream
The client supports viewing time-temperature curves for radiometric videos, trend videos, and live analysis. The time-temperature curve represents the temperature change in a video or stream or on certain measurement tool over time.
Opening the Time-Temperature Curve Window
-
In the task list of Analysis tab, select one radiometric video or trend video, or connect the thermal imager/camera to Live analysis.
-
In the analysis tab, click the toolbar icon to open the list of supported windows for addition.
-
In the dropdown list, select Add Time-Temperature Curve. The new window is displayed below the thermal image by default.
-
Configure the temperature curve displayed in the chart.
 to open the list of supported windows for
addition.
Configuring and Viewing the Time-Temperature Curve
-
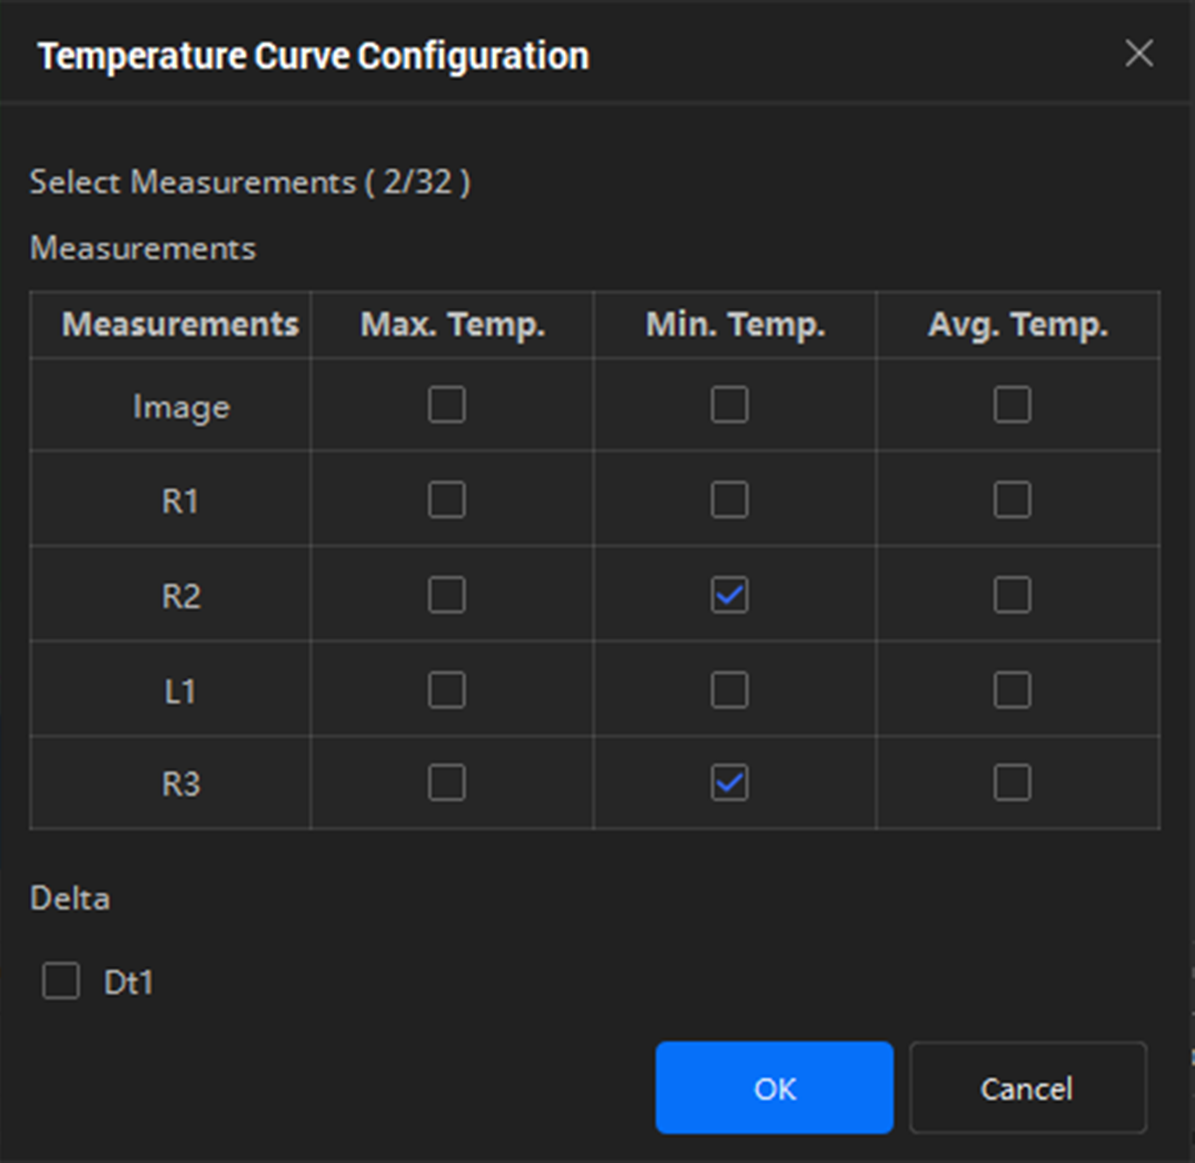
Click the icon in the upper-right corner of the temperature curve to open the settings window.
-
Check the temperature curves you want to display (maximum temperature, minimum temperature, average temperature, and delta). Up to 32 curves are allowed.
Figure 1 Temperature Curve Configuration -
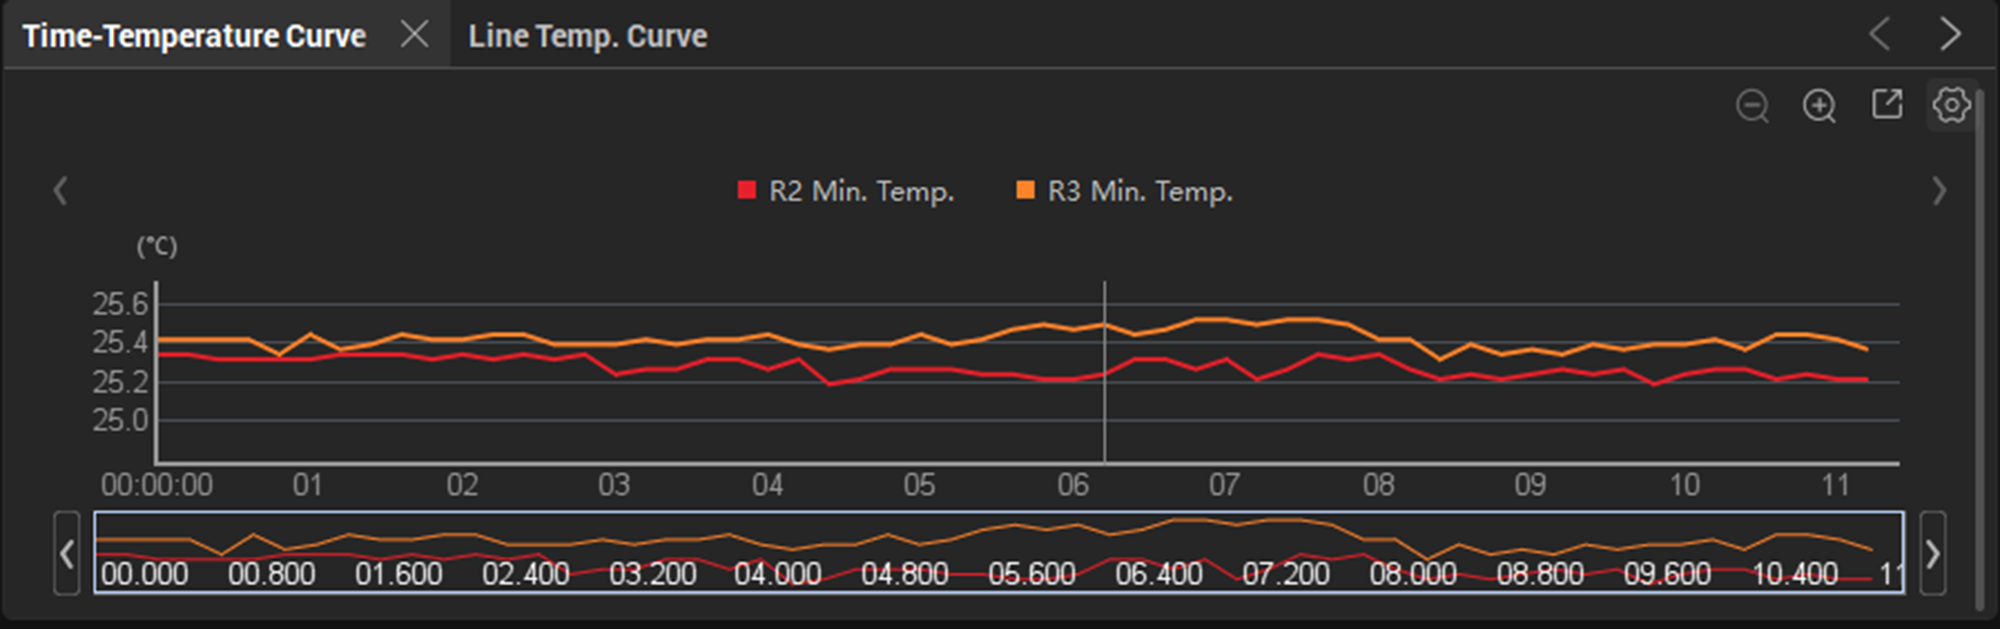
Adjust the time range displayed in the chart. Use the mouse wheel or click the icon to zoom. Place the cursor at the left/right edge of the window below the curve and drag left/right to view temperature change trends over different time periods.
-
Hover the mouse over the temperature curve and move it to view the temperature at different time points on the curve.
Figure 2 Time-Temperature Curve
 icon in the upper-right
corner of the temperature curve to open the settings window.
 icon to zoom. Place the
cursor at the left/right edge of the window below the curve and drag
left/right to view temperature change trends over different time
periods.
Export Image and Data
The time-temperature curve can be exported as an image or CSV format data for saving.
-
Export Image: Right-click anywhere on the chart and select Export Image to save it as a JPG format image. Image editing is not supported.
-
Export Data: Click the icon in the upper-right corner of the chart to open the Export Max./Min./Avg. window. Set the parameters and click OK to export.
- Data Orientation
-
The arrangement of data in the CSV table.
Vertical: Exported data for each frame is arranged from top to bottom in chronological order.
Horizontal: Data for each frame is arranged from left to right in chronological order.
- Select Measurements/Delta
-
Check the image or measurement tool results you want to export.
- Select Frames
-
Set the video frames covered by the exported data.
All: Exports the check data from all frames of video.
Custom: Export the check data from the selected frames (from the Start Frame to the End Frame).
 icon in the upper-right corner of the chart to open the