Set Overlays
Overlay refers to the measurement tools, parameters, measurement results, arrows, and other information displayed on thermal images, videos, and live stream, as well as the maximum intensity shown on acoustic images. Under specific circumstances, you can adjust the position, size, color, arrow visibility of the overlay, etc.
Adjusting Overlay in Analysis and Live Tabs
Overlay information in the thermal analysis and live window is mainly divided into two types: Display in Top-Left and Display with Measurements. Switch between them via . Acoustic analysis only support Display in Top-Left.
-
Overlay location settings apply to images (including live snapshots) and live stream analysis, but not to radiometric videos (including videos recorded during live stream analysis).
-
For the radiometric videos, measurement results only display in the top-left corner. Measurement tool names and colors can be modified via the Overlay Settings in the right-click menu.
- Display in Top-left
-
Measurement parameters and results are displayed in a vertical list starting from the top-left corner of the image.
-
Select a non-tool area. Use Overlay Settings in the right-click menu or double-click the top-left info box to configure overlay items such as measurement parameters.
Select a non-tool area. Use Top-Left Overlay Settings in the right-click menu to adjust size (scaling), font, font color, and background color.
-
Select a tool area. Use Tool Overlay in the right-click menu to configure specific tool overlay items, such as modifying tool names/colors and setting displayed temperatures/parameters.
-
Click Reset to return to default settings.
NoteParameters and results related to the entire image are displayed in the top-left info box by default and cannot be moved.
-
- Display with Measurements
-
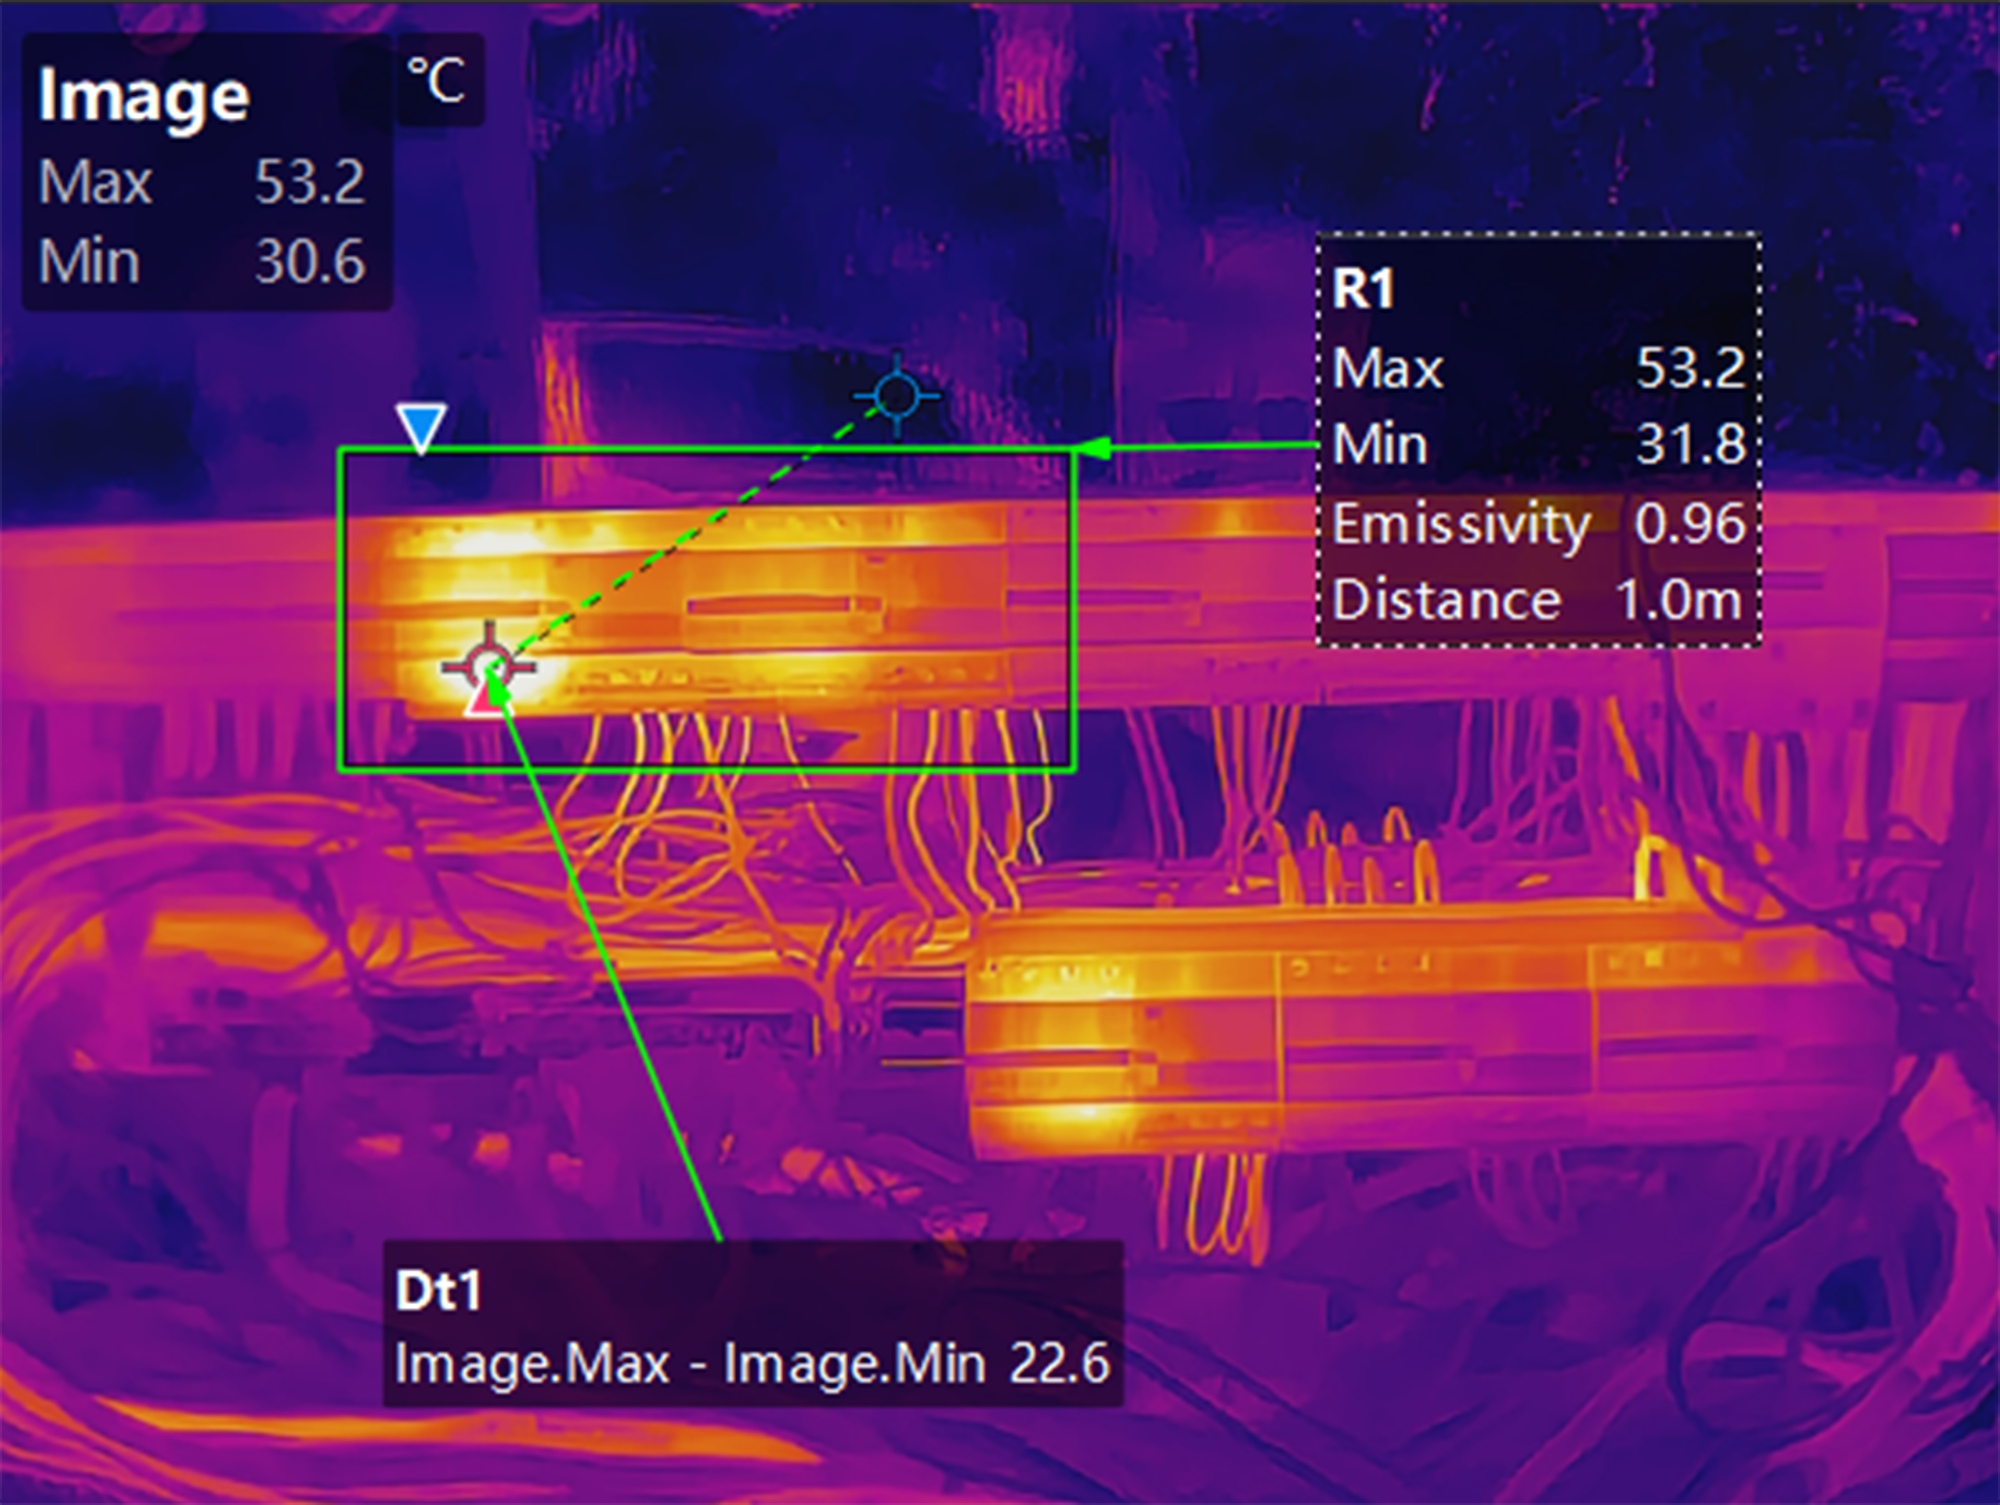
Measurement parameters and results are displayed around the measurement tool. Info box size, background, color, and position are adjustable.
- Adjusting Display Items and Color
-
-
Double-click the overlay info box or select a tool area and use Tool Overlay in the right-click menu to open settings.
-
In settings, configure tool name/color, overlay content items, size (scaling), font, text/background color, arrow visibility (auto-generated when a info box is far from the related tool), and arrow color.
-
Click Remember to apply modified settings to future tools.
-
Click Reset to restore to the default settings.
-
- Adjusting Info Box Position
-
-
Click and drag the info box to adjust its position. If Show Arrow is enabled, an indicator arrow is auto-generated when the info box is far from the tool.
-
The client supports restoring overlays to default positions.
In non-tool areas, use Restore All to Default Overlay Position in the right-click menu. For a specific tool, use Restore to Default Overlay Position.
-
Adjusting Overlay for Exported Images/Videos
Exported images and materials generally retain preview overlay content and effects (except for some effects). Additionally, you can overlay time, temperature scale of thermal images, PRPD diagram of PD acoustic images, leak cost of LD acoustic images, etc. Configure via .
Arrows are not displayed when opening saved/exported images with standard photo viewers or video players. Arrows are only visible when opening radiometric images in this client.